The $1000 IllusionWhy I Won’t Buy and Hold Through the Next AICrash
The $1,000 Illusion
Why I Won’t Buy and Hold Through the Next AI Crash
By Dyron Bush | Mechanics of Money
There is a sentence investors have heard so many times that it has practically become financial scripture:
“Just buy and hold.” Don’t worry about crashes. Don’t worry about recessions. Keep buying. Stay invested. The market always comes back.
Technically, there is truth in that argument. But there is something about it that bothers me: time has value. Once I account for time, inflation, purchasing power, opportunity cost, and the brutal mathematics of recovering from a major drawdown, I arrive at a very different conclusion.
The question isn’t merely whether the stock market eventually comes back. The question is:
What did waiting for it to come back cost me?
The Mathematics Wall Street Doesn’t Advertise
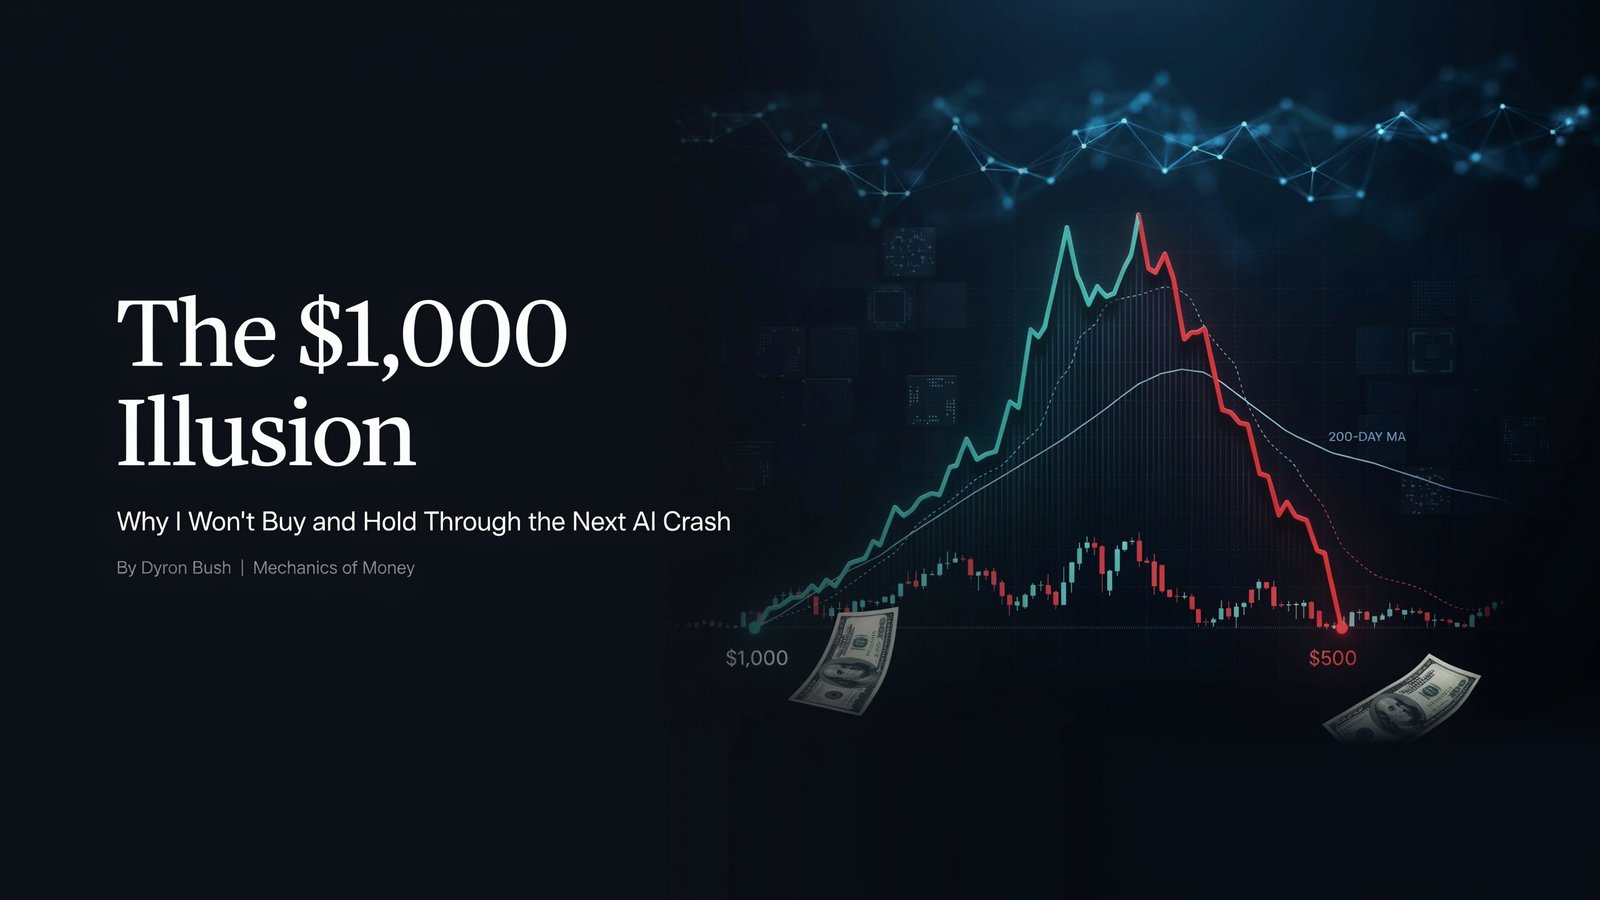
Start with $1,000. Lose 50%, and you have $500. To get back to $1,000 you do not need a 50% gain. You need a 100% gain. That asymmetry is why capital preservation deserves more respect than it gets during bull markets.
| Portfolio Decline | Gain Required to Recover |
|---|---|
| 10% | 11.1% |
| 20% | 25.0% |
| 30% | 42.9% |
| 40% | 66.7% |
| 50% | 100.0% |
| 60% | 150.0% |
The S&P 500 fell about 49% in the 2000-2002 bear market and roughly 57% in the Global Financial Crisis. A 50% drawdown is not a theoretical curiosity. It is part of modern market history.
My $1,000 Thought Experiment
Suppose a major bear market cuts my $1,000 investment to $500, and suppose it takes 14 years to reach a nominal $1,000 again. Wall Street may say I recovered. I say: which $1,000?
At 3% annual inflation, $1,000 received 14 years from now has purchasing power of only about $661 in today’s dollars. I would need roughly $1,513 in year 14 merely to equal the purchasing power of $1,000 today.
A nominal recovery is not necessarily an economic recovery.
The AI Boom Changes the Risk Conversation
Artificial intelligence may transform the global economy. That does not mean every AI-related asset is correctly priced. Transformational technology and overpriced securities can exist at the same time.
Railroads transformed America. The Internet transformed civilization. Neither prevented investors from overpaying during speculative booms.
The CAPEX Alarm Is Getting Louder
The current AI infrastructure cycle makes the valuation debate harder to ignore. Hyperscaler capital spending has risen dramatically as companies race to build data centers, acquire GPUs, expand networks, secure power, and create the physical infrastructure required for AI.
Research from Apollo has compared projected hyperscaler CAPEX with the late-1990s telecom and fiber buildout. Hyperscaler CAPEX was about 0.3% of U.S. GDP in 2019, reached roughly 1.4% in 2025, and consensus projections put it near 3% of GDP annually in 2027-2029. The telecom/fiber investment peak around 2000 was roughly 1.2% of GDP.
That does not prove a crash is imminent. It does tell me the price of disappointment is getting larger.
When capital expenditure accelerates on the assumption of enormous future profits, those profits eventually have to arrive.
The Great Disconnect: Price Versus Value
CAPEX alone would concern me less if valuations were cheap. They are not. The Shiller CAPE ratio has been near historically elevated territory, while other broad valuation measures have also signaled that investors are paying unusually high prices relative to underlying economic output and earnings.
This is the disconnect I watch: price is what someone will pay today; value is the future cash flow that ultimately has to justify that price. During speculative periods the two can separate for a very long time, but they cannot remain permanently disconnected.
Technology can be revolutionary. CAPEX can be excessive. Stock prices can be inflated.
All three statements can be true simultaneously.
Three Signals, One Story
I think of the framework as three instruments in an airplane cockpit.
- CAPEX tells me how aggressively the engines are running.
- Valuation tells me how high the aircraft has climbed.
- The 200-day moving average tells me whether the aircraft has started losing altitude.
I do not sell merely because CAPEX is high or because valuation is stretched. Markets can stay expensive for years. But when extreme investment, extreme valuation, and deteriorating price action begin occurring together, I pay attention.
Enter the 200-Day Moving Average
My preferred warning system is simple: the 200-day moving average. When the S&P 500 remains above its long-term trend, I treat the primary trend as intact. When it breaks below that trend and weakness persists, I look for confirmation from breadth, liquidity, and other market evidence.
The point is not to call the exact top or bottom. A rules-based trend system will almost certainly sell after the top and buy after the bottom. I am comfortable with that. I want the middle – the part of a major decline that can destroy years of compounding.
Trend-following research, including work popularized by Meb Faber using a 10-month moving average roughly comparable to the 200-day measure, is best understood as a drawdown-control framework rather than a crystal ball.
It can whipsaw. It can lag. It can underperform buy-and-hold for long stretches.
There is no Holy Grail.
Why Preservation Changes the Recovery
Imagine two investors starting with $1,000. Investor A rides a 50% decline to $500. Investor B uses a disciplined risk-management process and preserves materially more capital.
When the recovery begins, Investor A is using gains to repair old damage. Investor B is compounding preserved capital. That is a fundamentally different mathematical position.
The first dollar I don’t lose never needs to be earned back.
Buy and Hold Isn’t Dead. Blind Buy and Hold Should Be Questioned.
Buy-and-hold remains formidable for investors with long horizons, diversification, low costs, tax awareness, and the ability to tolerate severe volatility.
But “the market eventually comes back” is not the end of the analysis. Inflation continues. Opportunity cost continues. Retirement gets closer. Time does not stop because my brokerage account has not recovered.
So when the next serious bear market arrives, I intend to watch CAPEX, valuation, liquidity, breadth, and especially the 200-day moving average.
Fundamentals tell me vulnerability exists. Price action tells me when investors may finally be acting on it.
Sources and Research Notes
- Charles Schwab – historical S&P 500 bear-market drawdowns and recoveries.
- U.S. Bureau of Labor Statistics – Consumer Price Index and purchasing-power methodology.
- Apollo Global Management – comparisons of hyperscaler AI CAPEX with prior U.S. investment cycles.
- S&P Global – hyperscaler capital-spending and investment-intensity research.
- European Central Bank – U.S. equity valuation and CAPE observations.
- Meb Faber – tactical asset allocation and long-term moving-average research.
- Congressional Research Service – historical technology investment booms and AI investment context.
Educational commentary only. This article is not individualized investment advice. Market timing and moving-average strategies can generate false signals, taxable transactions, and losses and cannot guarantee protection from market declines.